Checking Usage And Quotas
show-quota
show-quota is not yet available on the SCC.
It should be available by the end of 2024.
The show-quota program is provided for checking your usage and quotas on the cluster.
The data it uses is updated periodically (at least once per hour), so it displays the usage and quota when its data was last updated, not at the current instant.
By default, show-quota shows the usage and quotas for every data store of the calling user and all projects the user is in.
There are several command line options that can be used to control which projects to show (-p), disable showing user or project information (--no-user and --no-project), and change the output format.
The best way to see all available options is to use the -h or --help options.
Its current help message is:
glogin8:~ $ show-quota --help
usage: show-quota [-h] [-u USER] [-p [PROJECT [PROJECT ...]]] [--no-user]
                  [--no-project] [--ascii] [--no-color] [--json] [--simple]
                  [--short] [--yaml-like] [--warn]

Tool for getting user/project filesystem usage and quotas, which are printed
to stdout. Errors with getting users or projects or reading their information
are printed to stderr prefixed by '! '. The exit code is 0 if there were no
failures, and 1 otherwise (will always have some output on stderr).

optional arguments:
  -h, --help            show this help message and exit
  -u USER, --user USER  The user to get the usage and quotas for. Supports
                        names and UIDs. Default is the calling user.
  -p [PROJECT [PROJECT ...]], --project [PROJECT [PROJECT ...]]
                        The project/s to get the usage and quotas for.
                        Supports names and GIDS. The default is all projects
                        the user (calling user unless --user is given) is in.
  --no-user             Don't print the user usage and quotas.
  --no-project          Don't print the project usage and quotas.
  --ascii               Force use of only ASCII characters (no unicode).
  --no-color            Disable color even if stdout would support it.
  --json                Print in JSON format.
  --simple              Print in the simple format.
  --short               Print in the short format.
  --yaml-like           Print in the YAML-like format (not actually valid
                        YAML).
  --warn                Print in the warning format, which is like --short
                        except that it only prints for data stores where the
                        quota is exceeded or close to it.
The default, --simple, --short, --warn, and --yaml-like output formats are meant to be human readable.
The --json format is machine readable and is therefore useful in scripts.
Default Format
The default format shows all information in a human readable way along with a usage bar. Its output takes the form of:
User USERNAME
  Data Store DATA_STORE_1
    ...
  ...
  Data Store DATA_STORE_N
    ...
Project PROJECT_1
  Data Store DATA_STORE_1
    ...
  ...
  Data Store DATA_STORE_N
    ...
...
Project PROJECT_N
  Data Store DATA_STORE_1
    ...
  ...
  Data Store DATA_STORE_N
    ...
where the ellipses (...) denote additional input not included here for brevity.
The output for each data store prints out the following items:
- The data store name.
- The data store’s alias if it has one.
- A description of the data store.
- The filesystem path/s to the directory/ies belonging to the user/project (each will be on its own line).
- The underlying filesystem, possibly with additional information.
- Block usage and quota, which will consist of lines indicating the usage, limits (if present), grace time if applicable, an indication of being over limits if applicable, the last time the data was updated, and a usage bar if there is at least one limit.
- Inode usage and quota in the same format as for block usage and quota.
An example when a user is below both the soft and hard limits for a data store would be
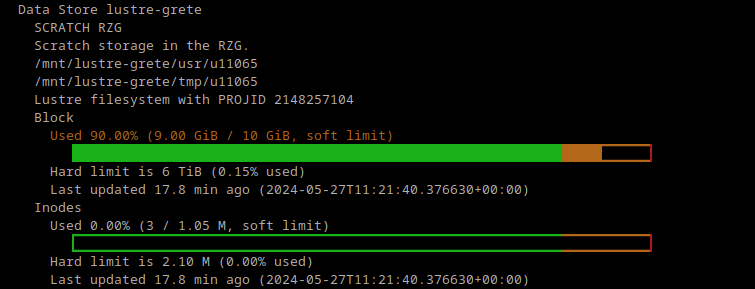
Usage and quota when below both limits with color and unicode.
  Data Store lustre-grete
    SCRATCH RZG
    Scratch storage in the RZG.
    /mnt/lustre-grete/usr/u11065
    /mnt/lustre-grete/tmp/u11065
    Lustre filesystem with PROJID 2148257104
    Block
      Used 90.00% (9.00 GiB / 10 GiB, soft limit)
        [##################################################################------]
      Hard limit is 6 TiB (0.15% used)
      Last updated 28.4 min ago (2024-05-27T11:21:40.376630+00:00)
    Inodes
      Used 0.00% (3 / 1.05 M, soft limit)
        [------------------------------------------------------------------------]
      Hard limit is 2.10 M (0.00% used)
      Last updated 28.4 min ago (2024-05-27T11:21:40.376630+00:00)
With color enabled, the usage bar (and usage relative to a limit) use green for under 85%, yellow/orange for 85-100%, and bold red for 100% and higher. No bar is shown if there is no soft nor hard limit.
An example when a project is between the soft and hard limits for blocks with an expired grace time and has no limits on inodes would be
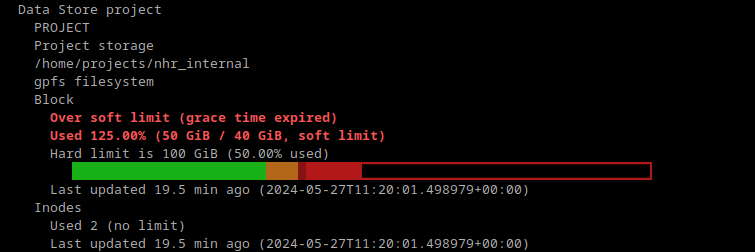
Usage and quota when between limits for blocks and having no limits on inodes with color and unicode.
  Data Store project
    PROJECT
    Project storage
    /home/projects/nhr_internal
    gpfs filesystem
    Block
      Over soft limit (grace time expired)
      Used 125.00% (50 GiB / 40 GiB, soft limit)
      Hard limit is 100 GiB (50.00% used)
        [############################|#######------------------------------------]
      Last updated 30.1 min ago (2024-05-27T11:20:01.498979+00:00)
    Inodes
      Used 2 (no limit)
      Last updated 30.1 min ago (2024-05-27T11:20:01.498979+00:00)
Notice how the output explicitly shows you that the user is over the soft limit and the grace time has expired.
An example when a user has exceeded the hard limit for blocks would be
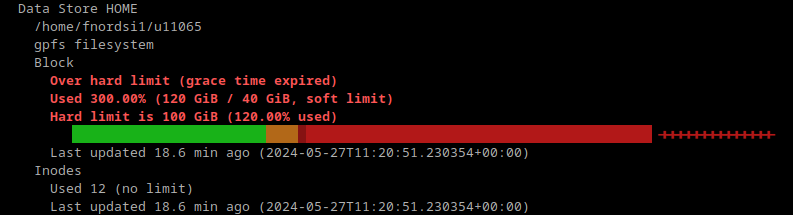
Usage and quota when over the hard limit on blocks with color and unicode.
  Data Store HOME
    /home/fnordsi1/u11065
    gpfs filesystem
    Block
      Over hard limit (grace time expired)
      Used 300.00% (120 GiB / 40 GiB, soft limit)
      Hard limit is 100 GiB (120.00% used)
        [############################|###########################################]++++++++++++++
      Last updated 29.2 min ago (2024-05-27T11:20:51.230354+00:00)
    Inodes
      Used 12 (no limit)
      Last updated 29.2 min ago (2024-05-27T11:20:51.230354+00:00)
Notice how any overshoot past the hard limit is shows extending past the end of the bar. Overshoot past the hard limit can happen since it can take a while for parallel distributed filesystems to notice the hard limit has been exceeded. This is also how it would look like if there is a soft limit but no hard limit and the soft limit is exceeded.
Simple Format
Use the --simple option to use the simple format.
The simple format is identical to the default format except that the usage bars are not shown.
Short Format
Use the --short option to use the short format.
The short format is the default format minus the usage bar, data store alias and dsecription, paths, and underlying filesystem information.
An example where a project is between the soft and hard limits on blocks and has no limit on inodes would be
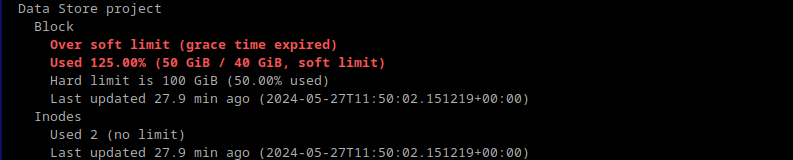
Usage and quota in the short format when between limits for blocks and having no limits on inodes with color and unicode.
  Data Store project
    Block
      Over soft limit (grace time expired)
      Used 125.00% (50 GiB / 40 GiB, soft limit)
      Hard limit is 100 GiB (50.00% used)
      Last updated 27.9 min ago (2024-05-27T11:50:02.151219+00:00)
    Inodes
      Used 2 (no limit)
      Last updated 27.9 min ago (2024-05-27T11:50:02.151219+00:00)
Warn Format
Use the --warn option to use the warn format.
The warn format is identical to the short format except that only data stores where the usage is 85% or greater than the soft and/or hard limits are shown, any output is indented by two more spaces, and the first line printed to stdout is Over quota/s or close to them: if any data stores are close to or have exceeded a soft and/or hard limit.
If the user or a project has no data stores over a limit or close to a limit, nothing is printed for the user or that project.
If you and your projects are not over or close to the limits on any data store, show-quota --warn will print nothing.