NVTOP & Nsight Systems
NVTOP
In HPC environments, GPU-intensive workloads often require real-time monitoring of GPU utilization.
NVTOP (Neat Videocard TOP) is a light-weight, (h)top-like Linux command-line tool, that interactively reports on GPU usage.
On the cluster, the command module spider nvtop can be used to check available versions and other required modules to be loaded.
Currently, loading nvtop also requires either gcc/13.2.0 or gcc/13.2.0-nvptx.
So, to load the nvtop module, please do:
module load gcc/13.2.0
module load nvtop
Info
NVTOP monitors GPU activity on compute nodes, so that it must be run on a node equipped with an active GPU. For information on allocating GPU nodes, refer to the cluster’s GPU usage documentation.
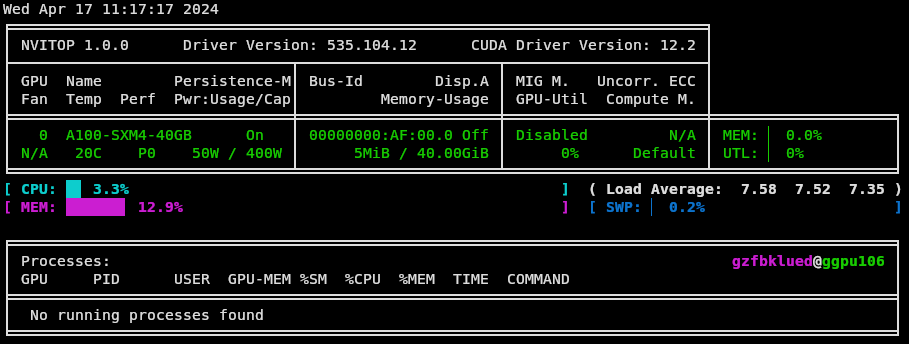
Below is an example output when using nvtop
Nsight Systems
NVIDIA Nsight Systems is a system-wide performance analysis tool used to visualize and analyze application behavior. It helps identify optimization opportunities and supports scalability analysis across CPUs and GPUs, from large servers to small system-on-chip (SoC) platforms.
Nsight Systems provides:
- Unbiased, system-level activity traces on a unified timeline
- Low-overhead data collection suitable for production workloads
- CPU parallelization and scheduling
- GPU SM (streaming multiprocessor) utilization
- CUDA workload and kernel activity
- Communication, I/O, and OS interactions
- Library-level traces
This tool enables users to examine relationships across hardware and software layers and diagnose performance bottlenecks in complex heterogeneous workloads.
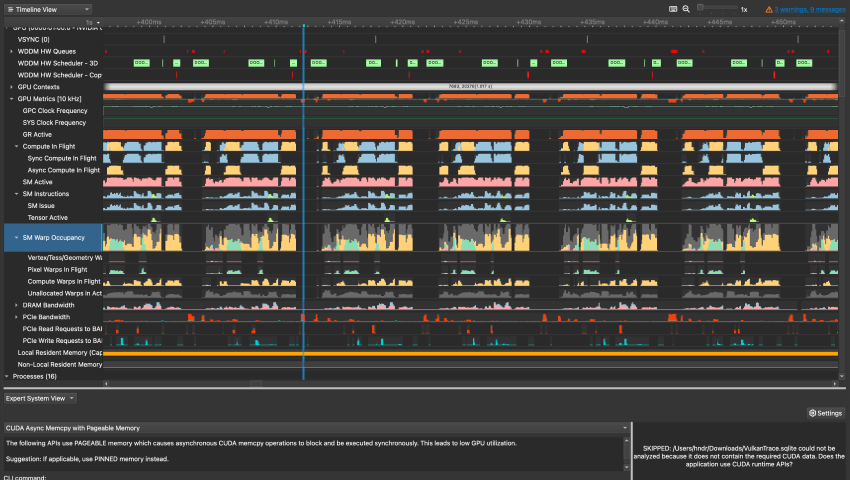
Below is an example output of GPU Metrics when using this tool. The image is an excerpt from the Nvidia Nsight Systems homepage). These metrics give an overview of GPU efficiency over time.
By default, the tool instruments the whole application. To profile your application effectively using Nsight Systems, so that the tool overhead is as minimum as possible, a focused approach is recommended. This can be accomplished by:
- Limit profiling to a region of your CUDA application using CUDA functions,
cudaProfilerStart()andcudaProfilerStop()to start stop profiling respectively. Note that you need to includecuda_profiler_api.h - Limit profiling to a region of CPU activity using NVIDIA Tools Extension API (NVTX)
To use the tool on the cluster, one needs to load the cuda module.
To get an overview of the available versions and required modules to be loaded, the command module spider cuda can be used.
For instance, to load the module cuda/12.9.2, one can do:
module load gcc/13.2.0
module load cuda/12.9.2
A default analysis run can be then performed by using the command nsys profile <application> [application-arguments].
Here nsys is the CLI tool for Nsight Systems.
For other targeted ways to invoke the tool and a more comprehensive guide to using Nsight Systems, we recommend the NVIDIA Nsight Systems documentation.