Likwid
LIKWID - “Like I Knew What I’m Doing”
LIKWID is developed by Friedrich-Alexander-Universität Erlangen-Nürnberg (FAU) for Performance Optimization, Modeling, and Architecture Analysis. It offers Command-line and Software Library interfaces. It supports architectures such as x86 and ARM, as well as NVIDIA and AMD GPUs.
There is extensive documentation in LIKWID’s Wiki
Quick Start
LIKIWID Toolset is available as a module, thus before using LIKWID a user need to load their preferred LIKWID version module to set the environment correctly.
(base) gwdu101:25 17:17:18 ~ > module show likwid
-----------------------------------------------------------------------------------------------------------------------------------------------------------------------------
  /opt/sw/modules/21.12/cascadelake/Core/likwid/5.2.0.lua:
-----------------------------------------------------------------------------------------------------------------------------------------------------------------------------
...

(base) gwdu101:25 17:17:24 ~ >
(base) gwdu101:25 17:18:33 ~ > module load likwid
(base) gwdu101:25 17:18:43 ~ >
The following tasks can be performed by LIKWID:
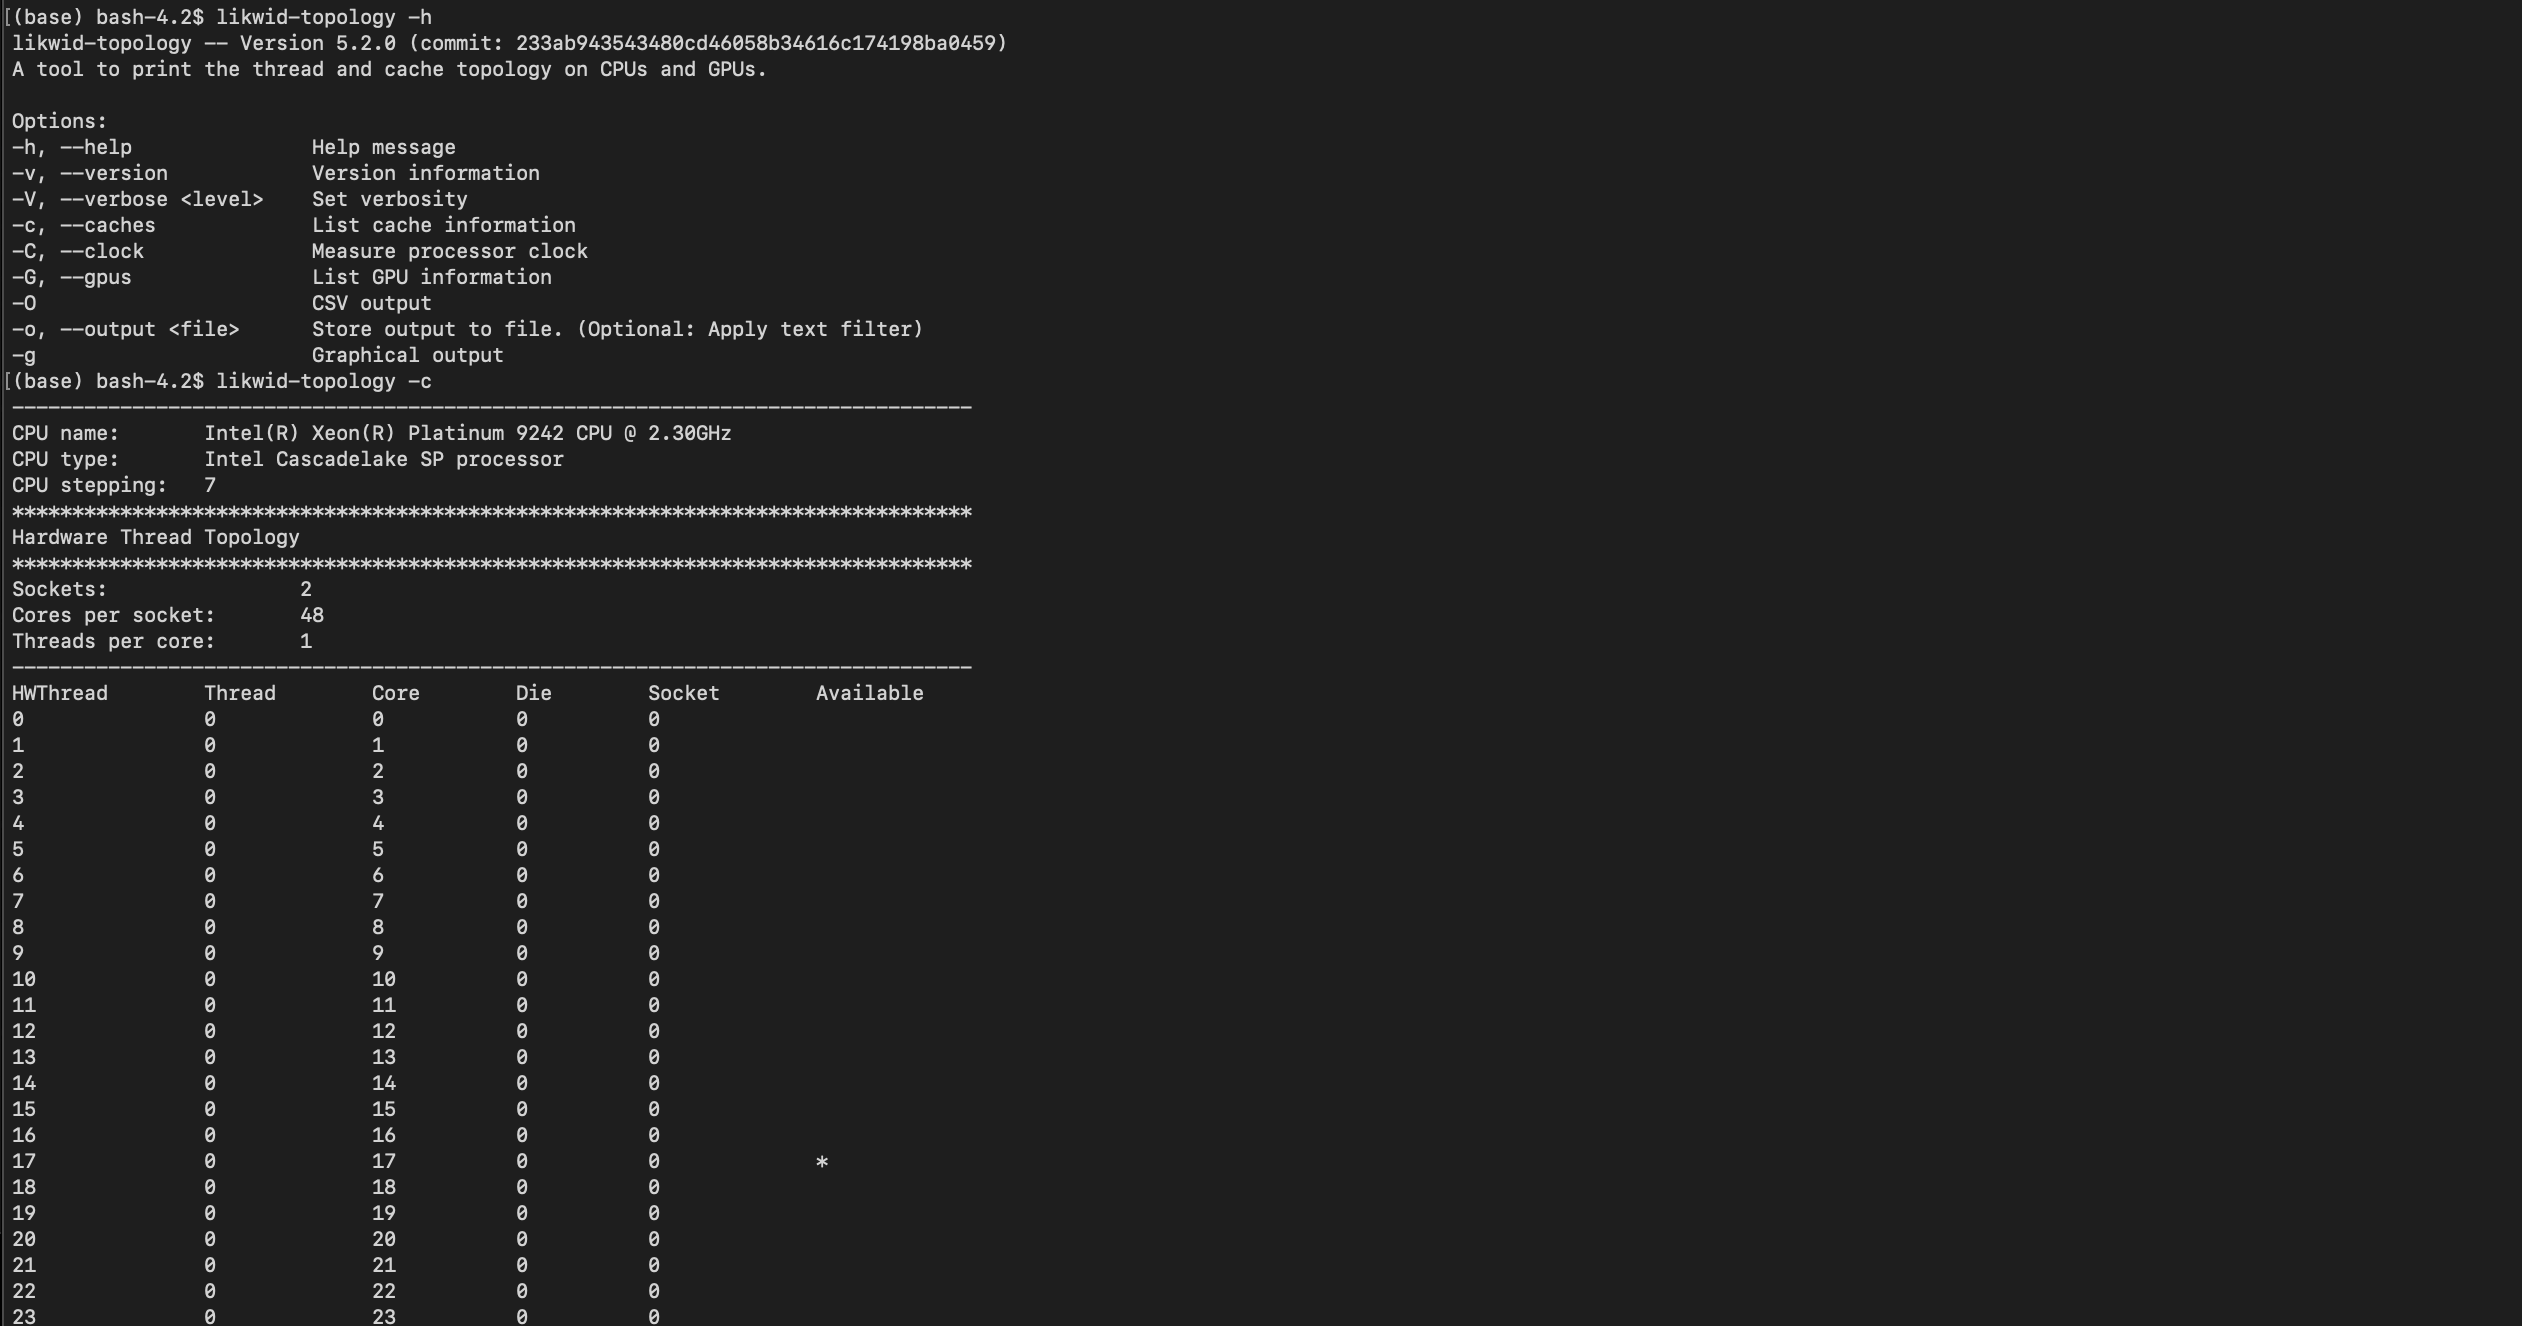
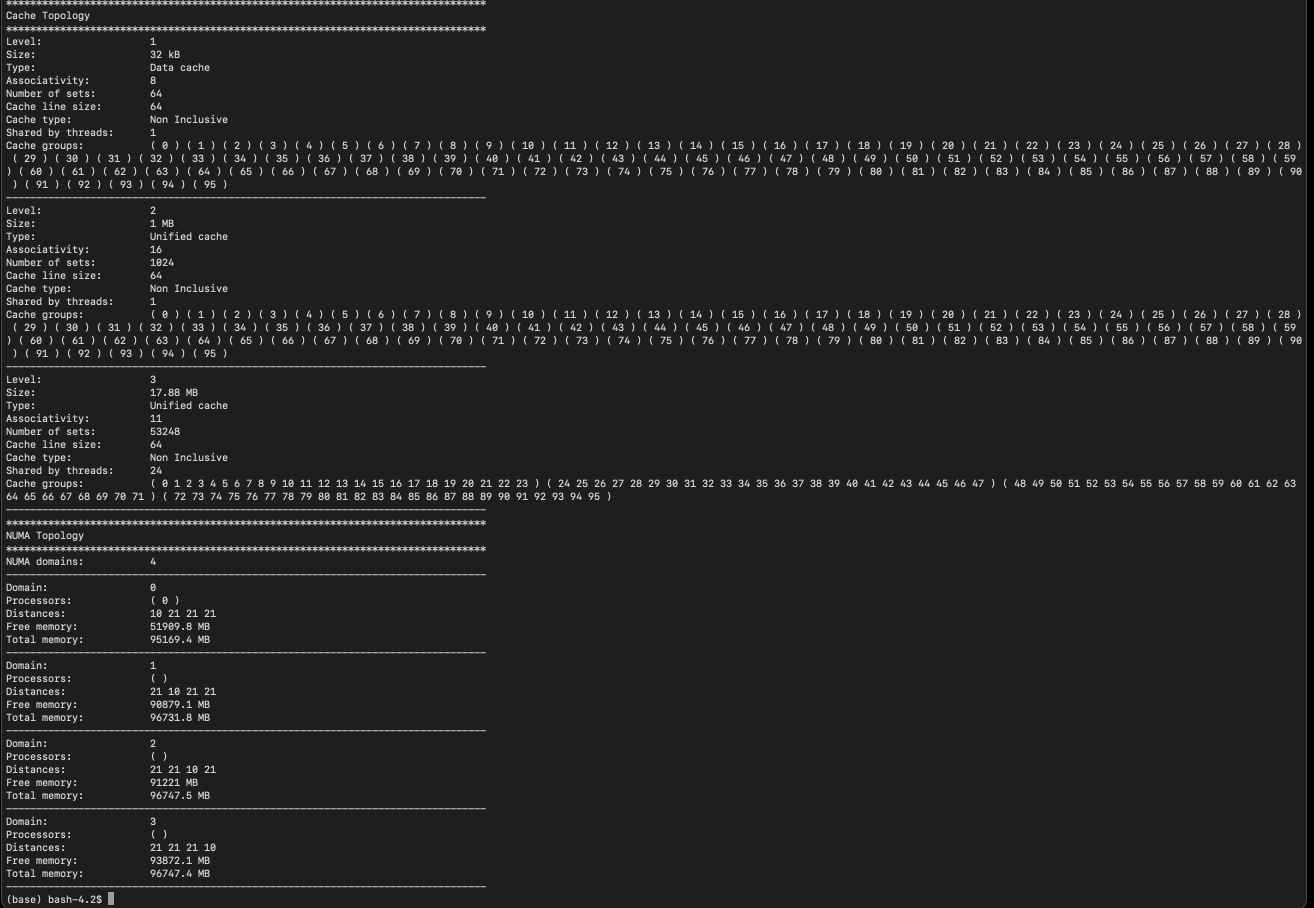
Node architecture information
$ likwid-topology
$ likwid-powermeter
Examples of node-architecture for SCC’s amp016:


Affinity control and data placement
$ likwid-pin
$ likwid-mpirun
Query and alter system settings
$ likwid-features
$ likwid-setFrequencies
Application performance profiling (perf-counter)
- Using the available hardware counters to measure events that characterise the interaction between software and hardware
- Uses a light-weight marker API for code instrumentation
$ likwid-perfctrMicro-benchmarking - Application and framework to enable:
- Quantify sustainable performance limits
- Separate influences considering isolated instruction code snippets
- Reverse-egineer processor features
- Discover hardware bugs
$ likwid-bench
$ likwid-memsweeper
likwid-topology
- Thread topology: How processor IDs map on physical compute resources
- Cache topology: How processors share the cache hierarchy
- Cache properties: Detailed information about all cache levels
- NUMA topology: NUMA domains and memory sizes
- GPU topology: GPU information
likwid-pin
- Explicitly supports pthread and the OpenMP implementations of Intel and GNU gcc
- Only used with “pthread_create” API call which are dynamically linked with the static placement of threads.
likwid-perfctr
- a lightweight command-line application to configure and read out hardware performance data
- Can be used as a wrapper (no modification in the application) or by adding “Marker_API” functions inside the code
- There are preconfigured performance groups with useful event sets and derived metrics
- Since likwid-perfctr measures all events on the specified CPUs, it is necessary for processes and threads to dedicated resources.
- This can be done by pinning the application manually or using the built-in functionality
Performance Groups
- An outstanding feature of LIKWID
- Organizes and combines micro-architecture events and counters with e.g. run-time and clock speed
- Provides a set of derived metrics for efficient analysis
- They are read on the fly without compilation by command-line selection
- Are found in the path
${INSTALL_PREFIX}/share/likwid
Examples of using likwid-perfctr on SCC’s amp016 node
- Use option
-ato see available performance groups: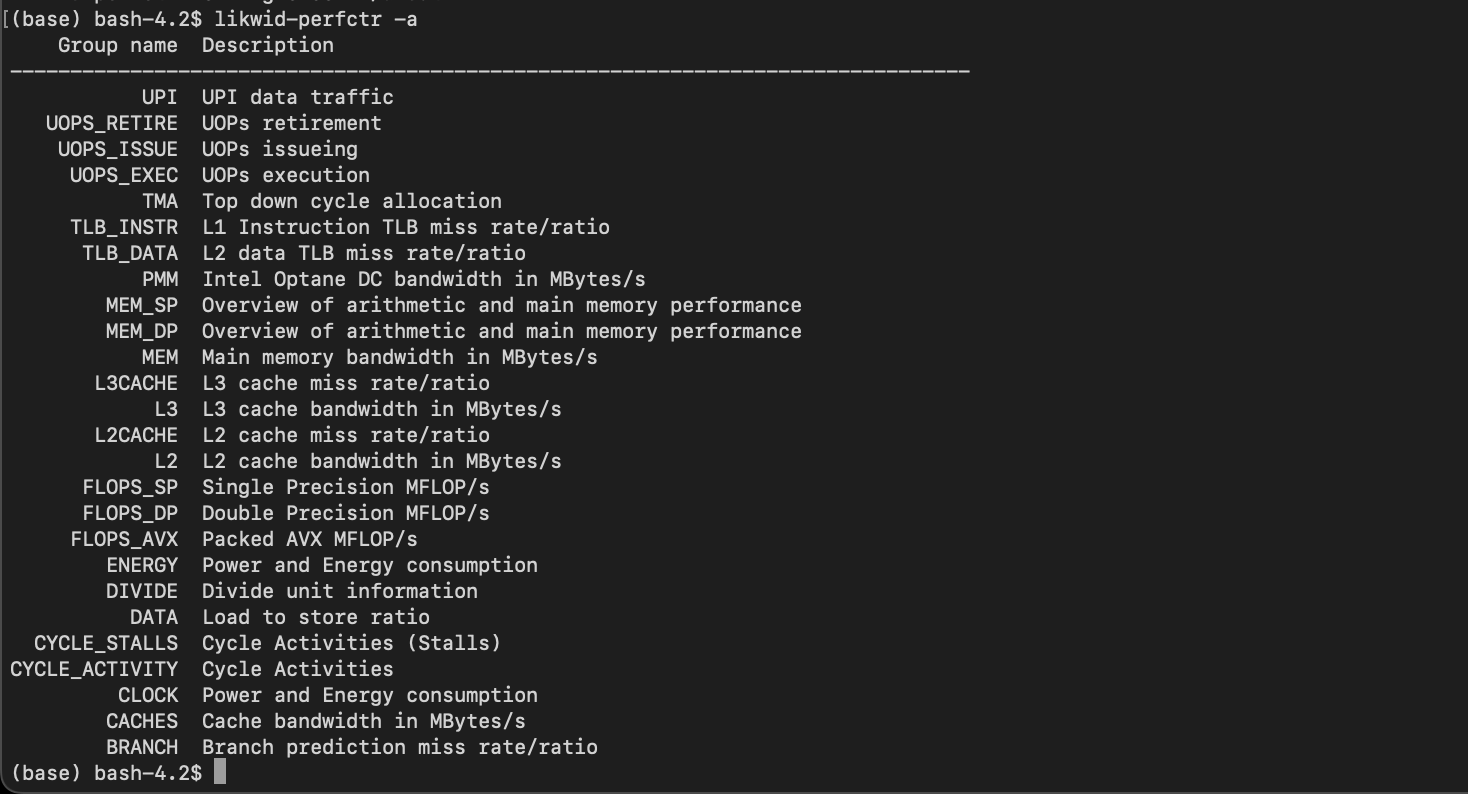

- Use
likwid-perfctr -g CLOCKto measure the clock speed.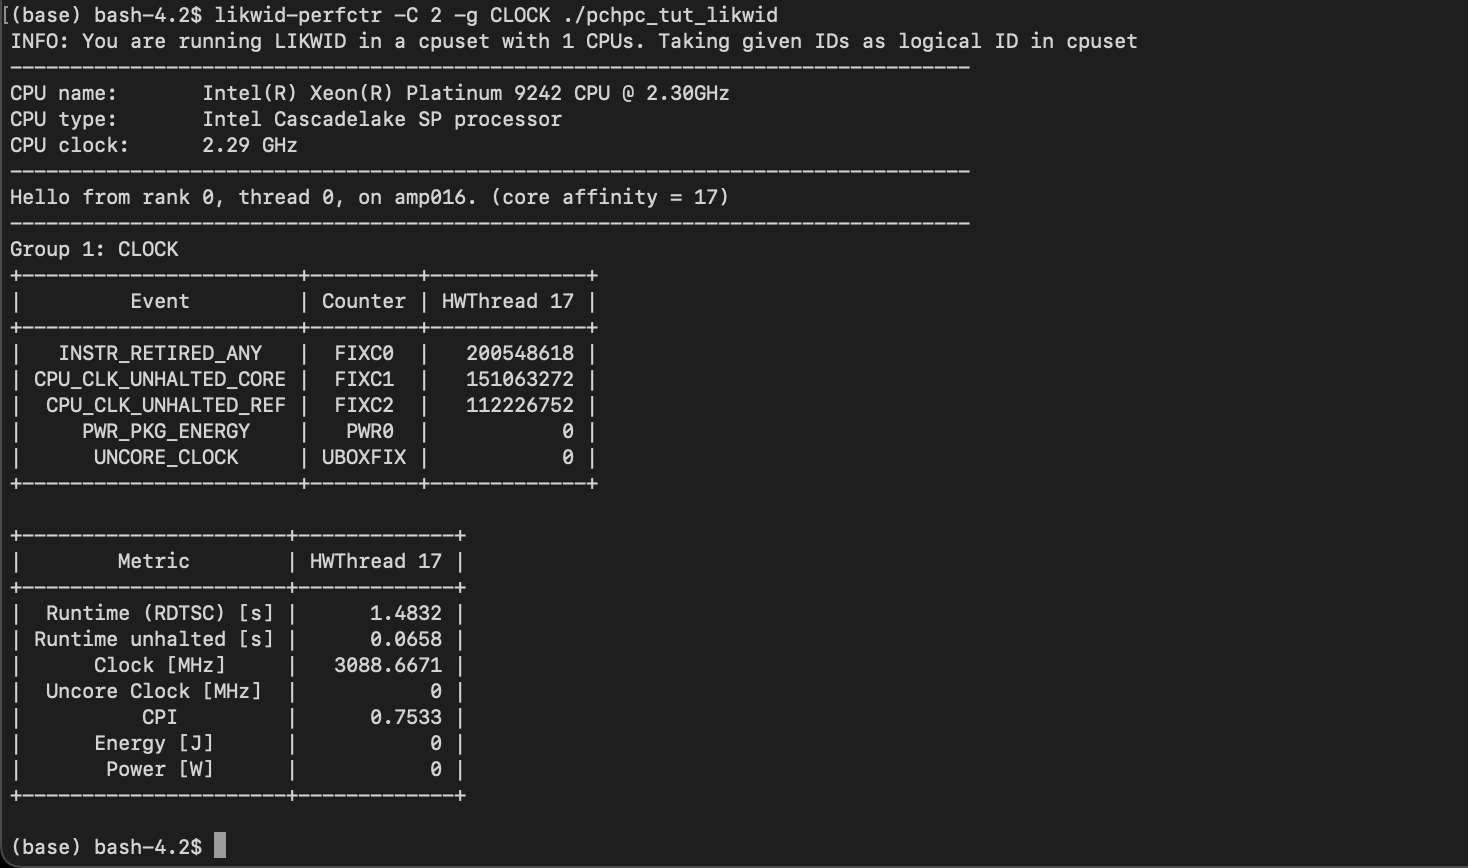

- Use
likwid-perfctr -g FLOPS_DPto measure the Arithmetic Intensity in double precision.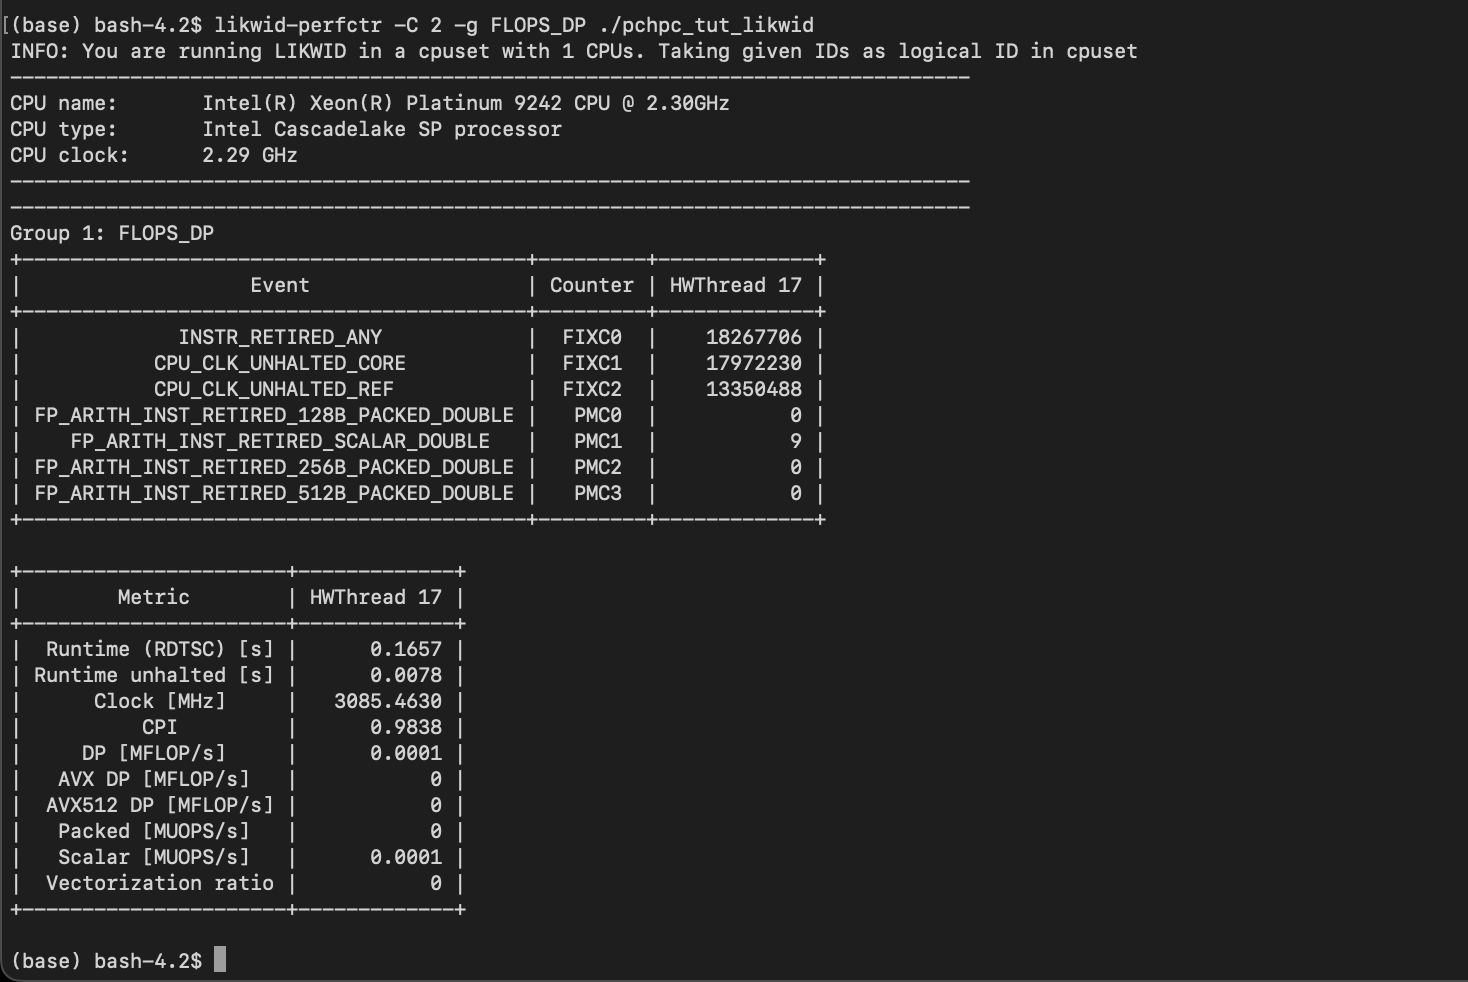

- Use
likwid-perfctr -g MEMto measure the bandwidth of primary memory.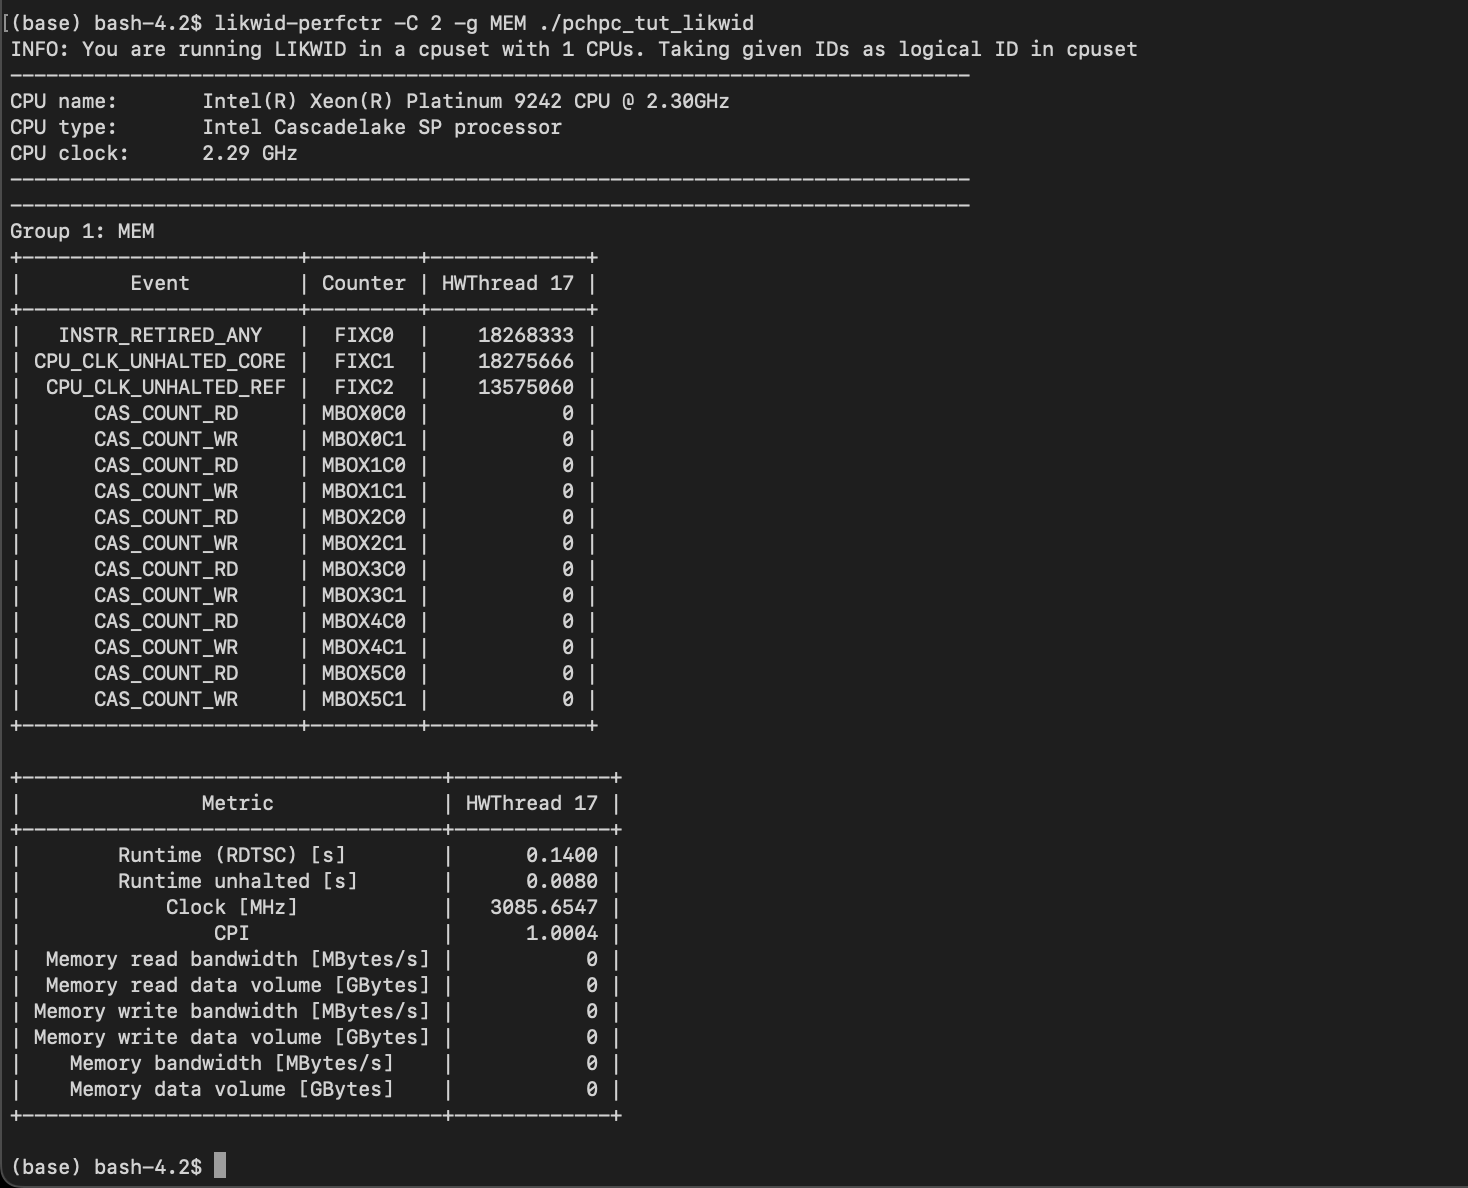

Marker API
- Enables measurements of user-defined code regions.
- The Marker API offers 6 functions (for C/C++) to measure named regions
- Activated by “-DLIKWID_PERFORM” to compiler calls
LIKWID_MARKER_INIT //global initialization
LIKWID_MARKER_THREADINIT //individual thread initialization
LIKWID_MARKER_START("compute") //Start a code region named "compute"
LIKWID_MARKER_STOP("compute") //Stop the code region named "compute"
LIWKID_MARKER_SWITCH //Switches perfromance group or event set in a round-robin fashion
LIKWID_MARKER_CLOSE //global finalization