Software Performance Engineering
In modern computing, efficient management and optimization of applications, both in terms of computation and input/output (I/O) operations, hold paramount significance, particularly when confronted with the challenges posed by Big Data, supercomputing, and parallel/distributed computing paradigms. Our team at GWDG can help users improve the performance of their applications within these complex and resource-intensive settings.
What is Performance Engineering
Performance engineering is the process of examining an application, finding what slows it down or prevents it from performing well, and improving those parts. This includes analysis of computation and input/output (I/O) patterns.
Why studying performance matters
Performance issues in HPC applications arise from complex interactions between computation, memory, and I/O. Computational inefficiencies, such as poor parallelization, load imbalance, excessive synchronization, or inefficient use of CPU/GPU resources, can significantly slow down execution time. At the same time, suboptimal I/O patterns, contention on shared storage, or misconfigured software stacks can cause unnecessary stalls and reduce throughput. As HPC clusters consume huge amounts of energy to run, inefficient jobs can easily waste a lot of money and produce tons of unnecessary CO2 emissions (if the datacenter does not run on 100% renewable energy like ours). These resources could be spent running a lot more useful computations in the time saved by properly optimizing your code.
Modern workloads typically combine intensive computation with high data movement, so even small inefficiencies in either domain can propagate across the entire application, increasing runtime, resource usage, and operational costs.
Evaluating these behaviors is inherently challenging. Computation and I/O performance depend simultaneously on the application’s algorithmic structure, the parallel programming model (e.g., MPI, OpenMP, CUDA), the I/O stack and access patterns, the hardware architecture, and the heterogeneous nature of HPC systems.
Computation Performance
Computation performance describes how efficiently a computing system uses its resources to execute a given task. As a simple example, it can refer to utilizing all available CPU cores to achieve the maximum speedup a node can offer. It reflects the system’s ability to complete work quickly, efficiently, and with the minimum amount of wasted resources for a specific workload.
In parallel and HPC environments, computation performance highly depends on how well an application maps its instructions to the resources. Factors such as load balancing, communication overhead, synchronization, and the used parallelization methods can have a profound effect on the performance. In such environments, many resource elements such as CPU cores, GPUs, memory hierarchies, and interconnects interact simultaneously. Their behaviors are tightly coupled, and a small imbalance in work distribution can increase communication, increased communication can intensify synchronization, and synchronization delays can leave compute units idle. These effects cascade across nodes and accelerators, making computation performance the result of intertwined factors rather than isolated components. As a result, evaluating and improving computation performance of an application requires understanding how these resource constraints and interactions collectively shape the application’s behavior at scale.
I/O Performance
I/O encompasses all operations outside pure computation. Any data that must be consumed or produced by compute units needs to move across the system: between memory layers, into and out of processors, and across nodes in a distributed environment. These data movements, whether local or across the network, constitute I/O activity.
I/O performance refers to how efficiently a system can move data and rate at which individual read/write operations can be serviced. For example, when data required by a computation is not locally available, accessing it through storage systems or over the network can introduce delays that directly affect application progress.
Our Offer
Analyzing performance is not a trivial task. Each analysis tool is designed for specific purposes and relies on its own definitions and calculations of performance metrics. As a result, tools may report different values for the same workload. For example, some aggregate I/O metrics, while others separate them by interface such as POSIX and MPI-IO. In addition, instrumenting applications is not always straightforward, as many tools require code changes, environment configuration, or runtime constraints. Differences in sampling granularity, tracing overhead, and support for parallel workloads further complicate the analysis.
Our service helps you understand and improve the performance of your applications. We analyze the code with appropriate tools, uncover the root causes of inefficiencies, and provide guidance to help you optimize it.
Tools
Because HPC systems and applications interact across thousands of possible events and layers, no single tool can capture all performance aspects. Some tools measure CPU and memory utilization; others trace filesystem operations; some aggregate metrics across processes, while others separate them by interface such as POSIX or MPI-IO.
Instrumenting applications is also not always straightforward due to tool-specific build requirements, environment settings, tracing overhead, and limited support for certain frameworks.
When switching tools, measurement continuity becomes a challenge: results must remain comparable, yet performance tools differ in methodology, output formats, and metric definitions, making consistency difficult to verify. This is especially true because performance tools fall into different categories: profiling, tracing, and monitoring, each focusing on a different way of capturing application behavior, see e.g. DOI: 10.1109/CLUSTERWorkshops61457.2023.00013.
In the following, we list some of the tools that are provided on the cluster of the GWDG.
Score-P: Scalable Performance Measurement Infrastructure for Parallel Codes
Score-P is a performance-measurement framework for C, C++, and Fortran applications that use multi-processing (MPI, SHMEM), thread parallelism (OpenMP, Pthreads), and accelerator models (HIP, CUDA, OpenCL, OpenACC, OpenMP-offload), as well as combinations of these. A Python interface is also available for tracing and profiling Python applications.
Score-P currently supports only MPI or SHMEM for multiprocessing. Other multiprocessing approaches (e.g., Torch distributed methods) cannot be traced. Score-P also does not support importlib.reload().
Score-P generates trace outputs in OTF2 and CUBE formats, which can be analyzed with tools such as Scalacasa, Vampir, TAU, and Periscope.
To instrument an application, the user must recompile it with the Score-P instrumentation wrapper. This wrapper is added as a prefix to the original compile and link commands. Score-P automatically detects the programming paradigm by parsing the original build instructions and selects the appropriate instrumentation methods, cf. [Score-P web page].
Usage
Use module spider scorep to list available versions on the cluster, and module spider scorep/<VERSION> to display dependencies for a specific version
To compile a program, prefix your compile command with scorep:
scorep gcc -o myApp [-fopenmp] myApp.cTo run the instrumented program, prefix the execution with scorep:
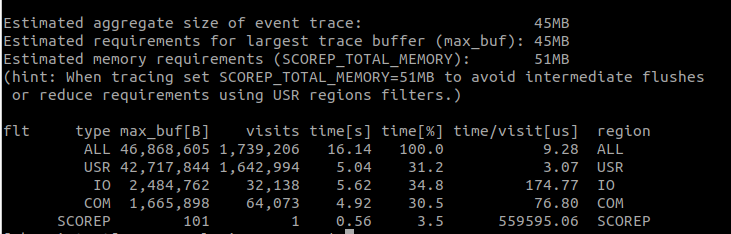
scorep ./myAppExample Output (scorep-score)
Below is an example of the output produced by scorep-score, the most basic Score-P analysis tool. It provides high-level trace information, including total trace size, memory requirements, and per-function statistics such as visit counts and time spent.
Vampir
Vampir is a visualization tool for handling and analyzing instrumented and sampled event traces generated by Score-P. It provides powerful performance-analysis capabilities for highly parallel applications.
Vampir is available as a commercial product since 1996, requiring purchase for “standard” or “professional” licenses directly from vampir.eu. However, it is usable as a module on the cluster of the GWDG.
To use Vampir remotely, X11 forwarding must be enabled when connecting to a node:
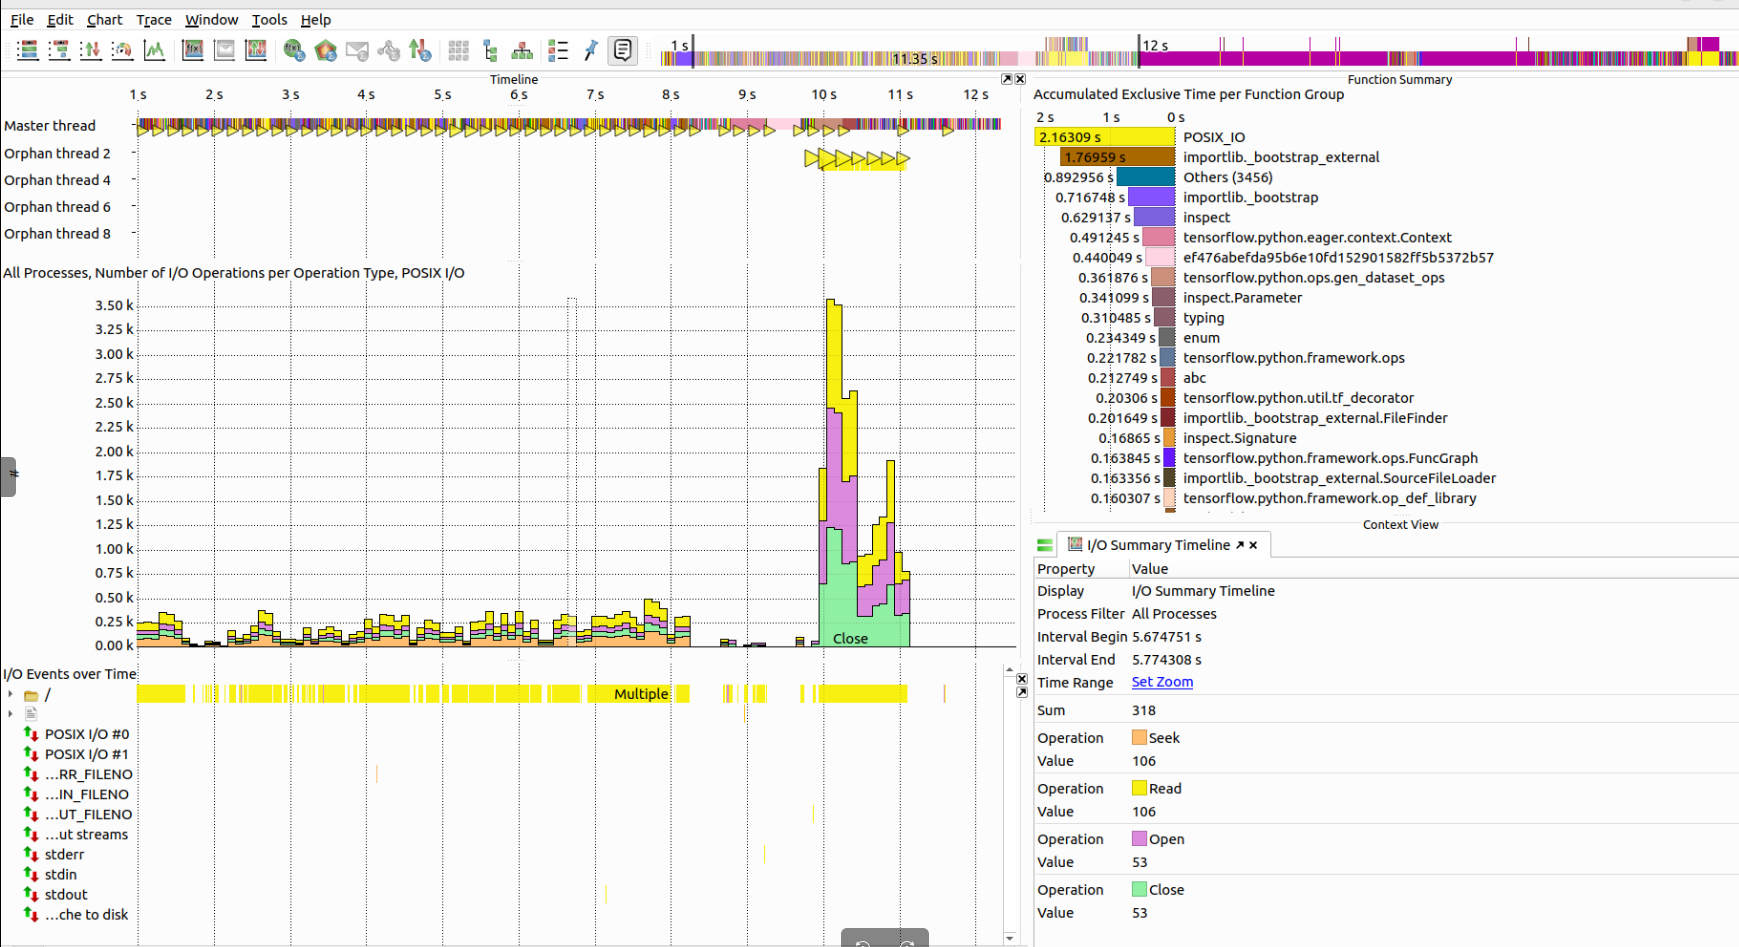
ssh -X glogin-gpu.hpc.gwdg.deVampir can be loaded with the same module commands used for Score-P. For example:
module load vampir/10.7.0Below is an example Vampir view, showing time-line based visualization of I/O operations alongside function summaries and activity distributions.
NVTOP
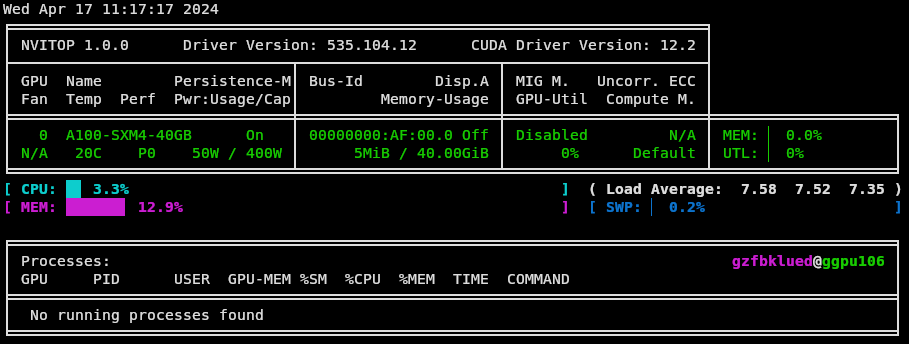
In HPC environments, GPU-intensive workloads often require real-time monitoring of GPU utilization. NVTOP (Neat Videocard TOP) is a Linux command-line tool, based on htop, that interactively reports GPU usage.
On the cluster, the spider command can be used to check available versions. Loading nvtop also requires gcc/13.2.0 or gcc/13.2.0-nvptx:
module load gcc/13.2.0
module load nvtop
Info
NVTOP monitors GPU activity on compute nodes, so that it must be run on a node equipped with an active GPU. For information on allocating GPU nodes, refer to the cluster’s GPU usage documentation.
Nsight
NVIDIA Nsight Systems is a system-wide performance analysis tool used to visualize and analyze application behavior. It helps identify optimization opportunities and supports scalability analysis across CPUs and GPUs, from large servers to small system-on-chip (SoC) platforms.
Nsight Systems provides:
- Unbiased, system-level activity traces on a unified timeline
- Low-overhead data collection suitable for production workloads
- CPU parallelization and scheduling
- GPU SM (streaming multiprocessor) utilization
- CUDA workload and kernel activity
- Communication, I/O, and OS interactions
- Library-level traces
This tool enables users to examine relationships across hardware and software layers and diagnose performance bottlenecks in complex heterogeneous workloads.
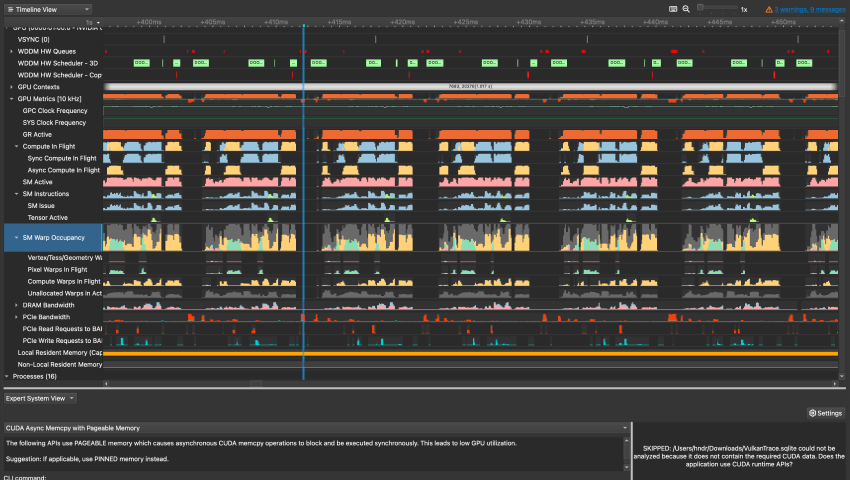 This picture was taken from the NVIDIA Nsight Systems documentation.
To use the module on the cluster of the GWDG, please refer to this page.
Contact
- Do you need assistance in improving your application’s performance?
- Write a ticket to our support, mentioning Performance Engineering in the subject
- You are looking for a course in the field?
- Check out our GWDG Academy courses.